Vaccination Trends and Deprivation
Figure 36 shows that Vaccination uptake tends to be much higher in the least deprived areas than in the most deprived areas and the difference grows with age. For 6-in-1 at 12 months there was a differential of 4.9 percentage points in 2024. This compared to a 7.6 percentage point differential for MMR1 (24 months) and 14.7 percentage point differential for MMR2 (5 years).
Figure 36 – Vaccine Uptake by SIMD Quintile. Click on the image to enlarge.
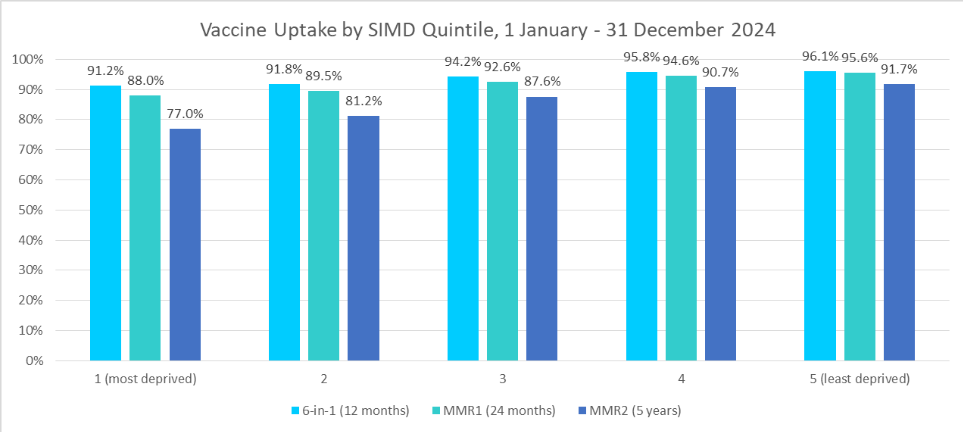
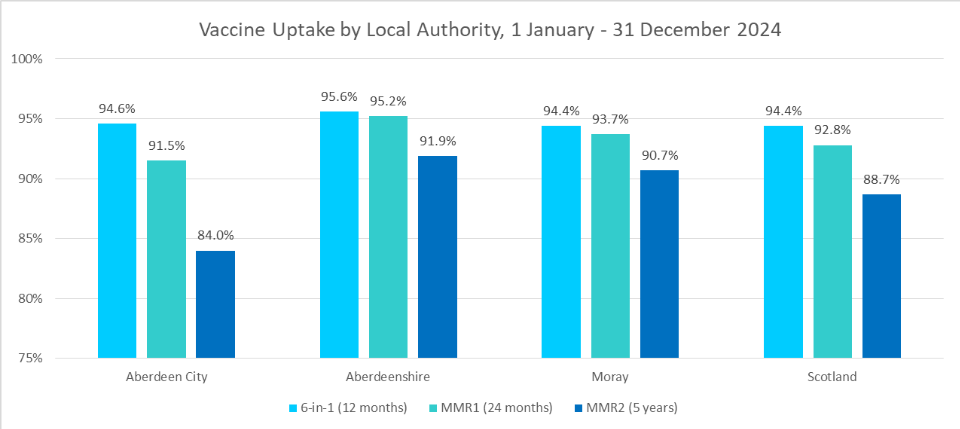
Figure 37 shows that vaccination rates are lower in Aberdeen City, reflecting higher levels of deprivation, but only for MMR1 (24 months) and MMR2 (5 years).
Figure 37 – Vaccine Uptake by SIMD Quintile. Click on the image to enlarge.
Back to Maternal Obesity
Next to Oral Health and Deprivation
Next to Chronic Morbidity Overview