
↓ Skip to Main Content
Hi-Net Grampian

Main Navigation

  • Home
  • About HI-Net
    • FAQs
    • Freedom of Information
    • Terms & Conditions
  • News & Events
    • News
    • Newsletters
    • Events Calendar
    • Campaigns
  • Information Resources
    • 5-year Health Equity Plan (2024-29)
    • Director of Public Health Annual Report
    • Evidence Updates Homepage – Public Health Key Documents
    • Statistical Information
    • Key Resources
    • Funding
    • Public Health Learning and Development Homepage
    • The Grampian Evaluation Network
  • People & Networks
Hi-Net Grampian

Off Canvas Menu

  • Home
  • About HI-Net
    • FAQs
    • Freedom of Information
    • Terms & Conditions
  • News & Events
    • News
    • Newsletters
    • Events Calendar
    • Campaigns
  • Information Resources
    • 5-year Health Equity Plan (2024-29)
    • Director of Public Health Annual Report
    • Evidence Updates Homepage – Public Health Key Documents
    • Statistical Information
    • Key Resources
    • Funding
    • Public Health Learning and Development Homepage
    • The Grampian Evaluation Network
  • People & Networks

ED Attendances

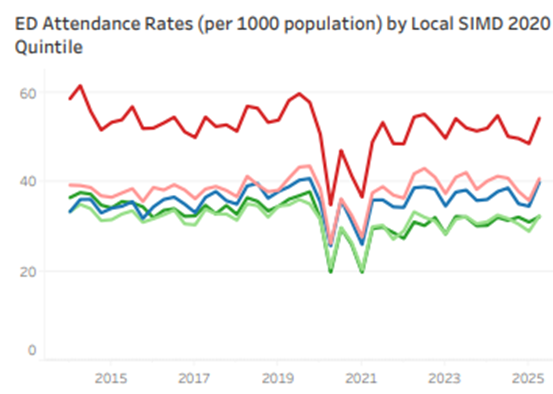
ED attendance rates are around 1.7 times higher in the most deprived quintile compared to the least deprived quintile, as illustrated in Figure 26 below.

Figure 26 – ED Attendance Rates by SIMD Quintile. Click on the image to enlarge.
Back to Alcohol Related Hospital Admissions

Next to Mental Health Referrals

Back to Health Inequalities in Grampian Trends

Next to Chronic Morbidity Overview

  • Joint Strategic Needs Assessments, Grampian population information and how they can inform service planning.
    • Grampian’s population, its health and what it means for service planning
      • Population Demographics
        • Age breakdown
        • Gender breakdown
        • Urban/Rural Split
        • SIMD
        • Birth & Death Trends
        • Ethnicity
        • What is causing the change in Grampian’s population demographics?
        • Projections
      • Health Inequalities in Grampian Trends
        • Impact of Deprivation on Life Expectancy & Healthy Life Expectancy
        • Alcohol Related Hospital Admissions
        • ED Attendances
        • Mental Health
        • Suicides
        • Drug Related Deaths
        • Maternal Obesity
        • Vaccination Trends and Deprivation
        • Oral Health and Deprivation
      • Chronic Morbidity
        • Burden of Disease
        • Healthy Life Expectancy
        • Life Expectancy
      • Mortality
        • Death Rates (All Ages)
        • Premature Mortality
        • Causes of Deaths
        • Avoidable & Preventable Deaths
      • Prevention & Risk Factors
      • Service Use
    • Joint Strategic Needs Assessment Guidance Grampian
      • Aims & role of JSNA in informing local planning and commissioning of services
      • Understanding what a JSNA is
      • JSNA Process
        • Stage 1 – Preparation and set-up
        • Stage 2 – Identifying health priorities
        • Stage 3 – Assessing a health priority for change
        • Stage 4 – Planning for change
        • Stage 5 – Evaluation
        • Publication and sharing of JSNA findings
        • Useful links and resources
      • Appendices
        • Appendix A – Useful links and resources
        • Appendix B – JSNA Checklist
        • Appendix C – Example JSNA template
        • Appendix D – Analytical Tools
        • Appendix E – Data domains & topics
        • Appendix F – Resource & Reference List
      • Common Acronyms / Abbreviations used
Copyright © 2026 Hi-Net Grampian | Powered by Responsive Theme