Age breakdown
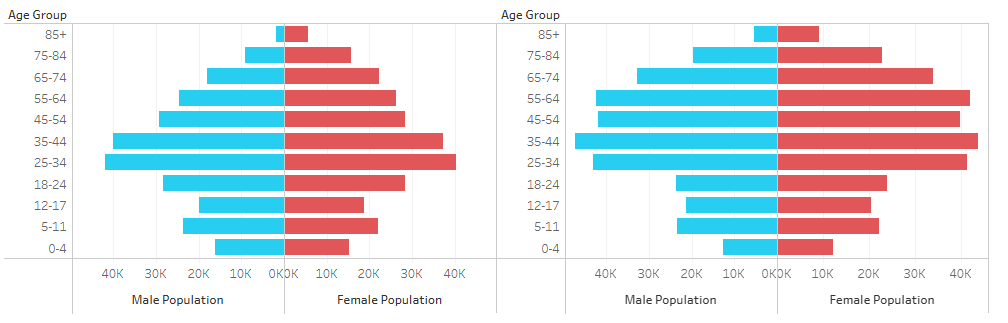
The population of Grampian has increased by 21% since 1991 and it is also growing much older (Figure 5). In 2025, 20% of the population were aged 65 years and over, compared to 14% in 1991. This equated to more than 50,000 extra people in this age group. 18% of the population were aged under 18 in 2025 compared to 23% in 1991. The Scotland wide age breakdown was similar in 2024 (NRS estimate) with 21% aged over 65 and 18% aged under 65. All councils across Scotland are seeing an ageing population but this is more marked in Aberdeenshire and Moray. The proportion of the population in Moray aged over 65 is amongst the highest in Scotland at 23%. Figure 6 shows the breakdown for Grampian and each council area for the key age groups to illustrate how patterns have changed over time.
Figure 5 – Age pyramid profile for Grampian population 1991 vs 2025. Click on the image to enlarge.
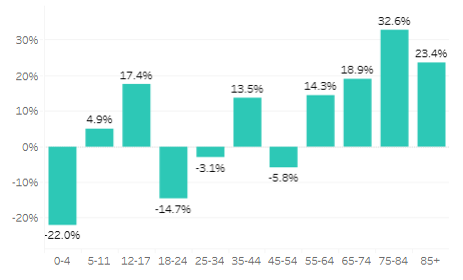
The large increase in the elderly population over the past decade contrasts sharply with a decline, of over 20%, in the under-five population (Figure 6), reflective of a substantial drop in the birth rate since 2020.
Figure 6 – Population Change by Age Group, 2015 to 2025. Click on the image to enlarge.
For more detailed information on the population demographics for Scotland and local council areas please look at the most recently published National Records for Scotland website (Population Estimates of Scotland – National Records of Scotland)
Back to Population Demographics
Next to Gender breakdown