Birth & Death Trends
In 2025, there were 4323 births in Grampian(Births in Scotland – Year ending 31 March 2025 – Births in Scotland – Publications – Public Health Scotland), 30% fewer than the average number of births in the 10-year period 2010 to 2020 (N=6157). Declining births is a year-on-year trend. A similar pattern is evident across Scotland but the drop has been less dramatic (20% decline). Based on local authority of residence, there were 1831 births in Aberdeen City (29% decrease from 2010 to 2020 mid-year average), 1846 in Aberdeenshire (27% decrease) and 577 in Moray (34% decrease).
The birth-rate dropped to 39.2 per 1000 women aged 15-44 in 2024/25 compared to a mid-year average of 54.1 between 2010 and 2020. Across Scotland the birth rate was 40.5 per 1000 women aged 15-44 in 2024/25 down from an average of 52.5 for the 10 years to 2020 meaning that Grampian has gone from having a higher birth rate than the Scottish average to a lower birth rate.
Figure 16 – Number of Births and Birth Rate in Grampian, 2005/06 to 2024/25. Click on the image to enlarge.
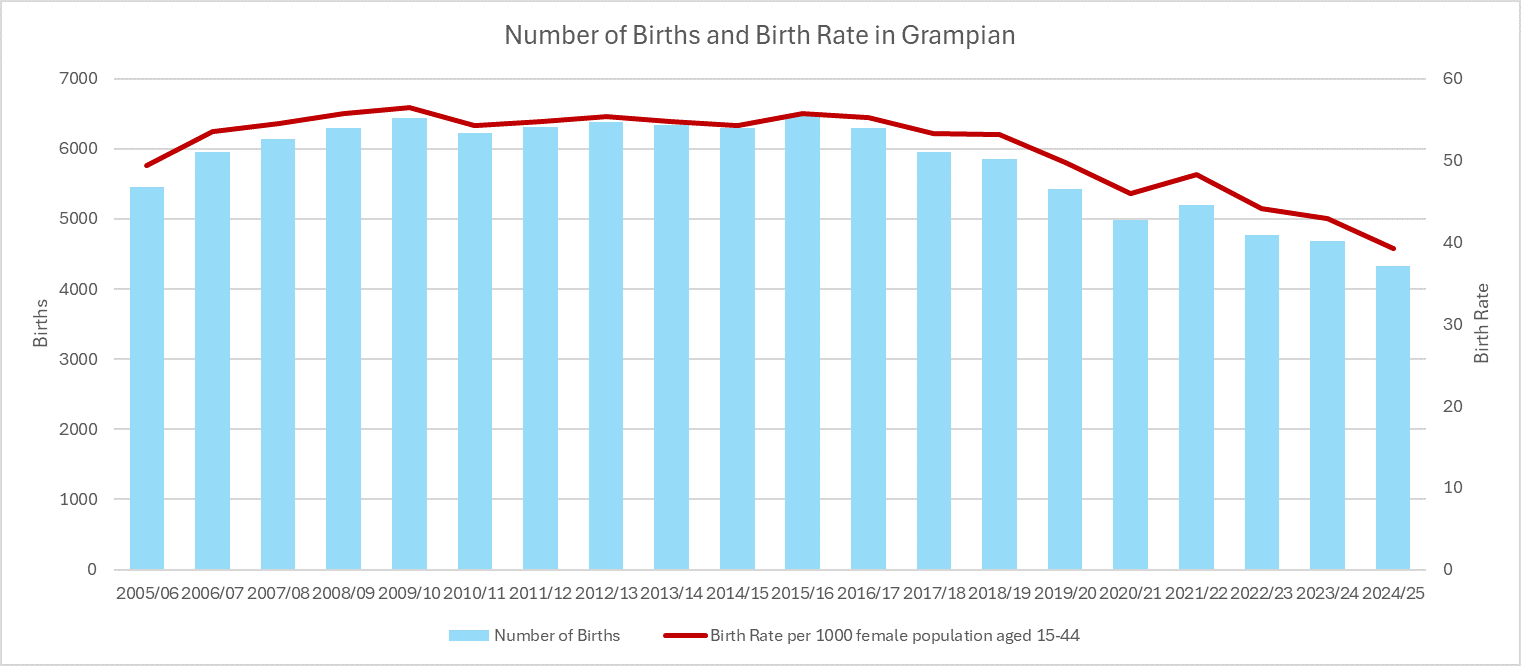
Figure 17 – Trends in deaths (all ages) for 2002-2004 to 2021-2023 for Aberdeen City, Aberdeenshire, Moray and Grampian (Scotland included as comparison). Click on the image to enlarge.
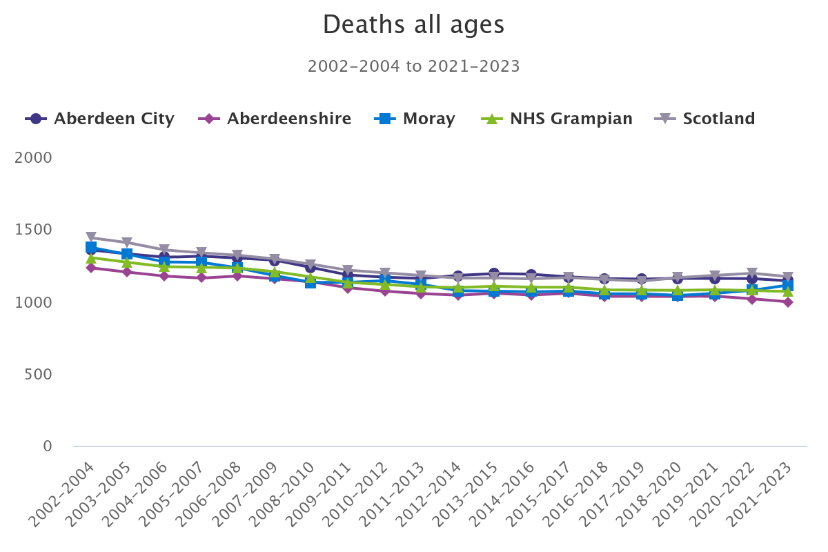
Source: Figure compiled using Population data in the ScotPHO profiles.
Impact of birth and death trends on the Grampian population
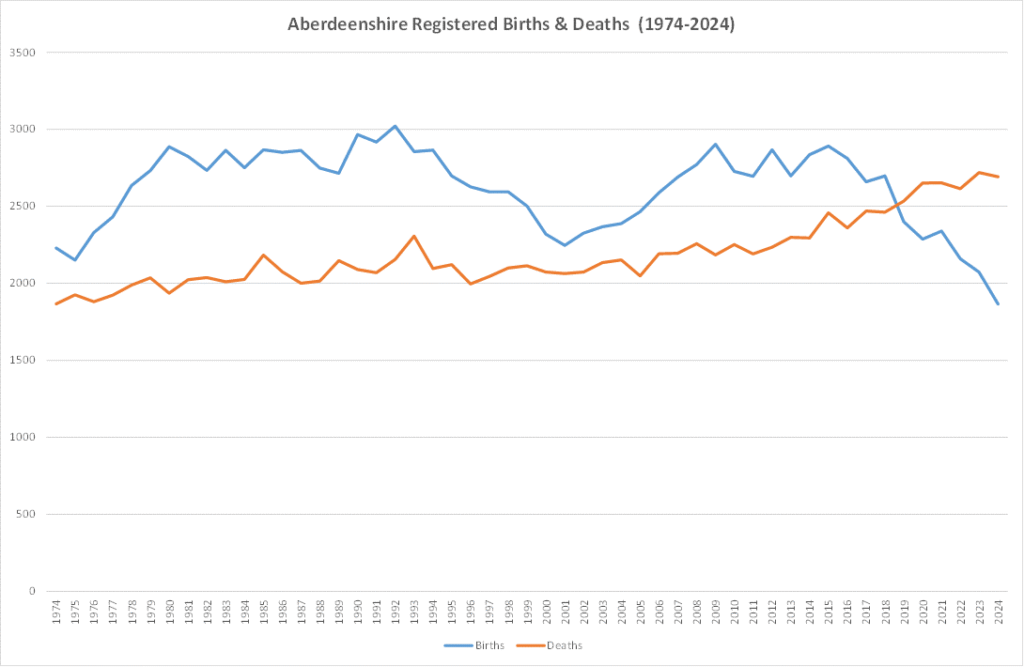
Until recently the number of births in Grampian have exceeded deaths each year, but starting in 2019 the number of deaths have been greater than births, and they are now trending in opposite directions. This has resulted in a declining natural population which can lead to shrinking school-age populations and pressure on working-age workforce, increasing dependency ratios. Migration over time will become critical to maintaining local economies and care workforces.
The excess of deaths over births is evident in all three areas but is particularly noticeable in Moray, every year from 2015 onwards where there is a clear divergence in trend (Figure 18).
Figure 18 – Impact of births (live) and deaths over time (1974-2024) in (a) Grampian, (b) Aberdeen City, (c) Aberdeenshire and (d) Moray. Click on the image to enlarge.
(a) Grampian


(c) Aberdeenshire
(d) Moray

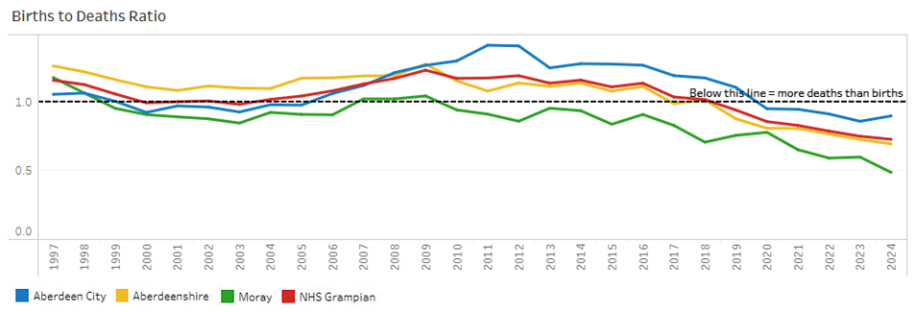
The ratio of births to deaths for Grampian, Aberdeen City, Aberdeenshire and Moray are shown below in Figure 19. The black dotted line in this figure indicates the level below which there are more deaths occurring than births. Since about 2016, there has been a steady decline in the births to deaths ratio highlighting that more deaths have occurred than births leading to a decline in Grampian’s population over time. Although a declining trend has been seen in all 3 areas, it is most significant in Moray and was evident at a much earlier time period (since 2009).
Figure 19 – Trends in births to deaths ratio from 1997-2024. Click on the image to enlarge.
Back to Population Demographics