Population Demographics
The following section provides more details on the underlying data which describes the population demographics for Grampian and the key headline facts and figures.
Underlying data to support population facts and figures
Information summarised on this page is based on information routinely published by the National Records of Scotland (NRS National Records of Scotland (NRS)) supplemented with locally available information from the Community Health Index (CHI) Register Our population | NHS Research Scotland | NHS Research Scotland to provide as timeously available information as possible.
The trends in population for Grampian and each local authority during 1991 to 2025 is shown in Figure 2. The population of Grampian was 625,636 in 2025 (according to the CHI register) which represents a 21% increase since 1991. In 2025, the population breakdown by local area was as follows: 40% in Aberdeen City (252,688), 44% in Aberdeenshire (273,441) and 16% in Moray (99,507) (Figure 3).
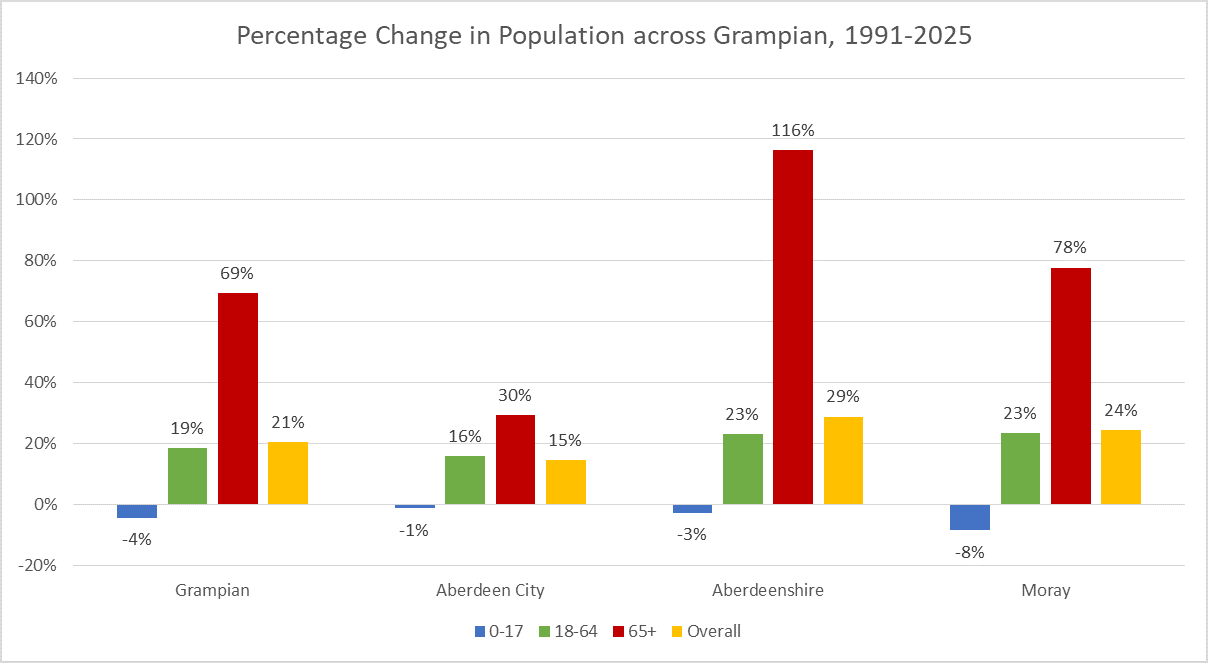
The greatest increases in population since 1991, have been in Aberdeenshire (29%) and Moray (24%) with Aberdeen City seeing a smaller increase (15%) (Figure 4). The under 18 population has fallen since 1991, most notably so in Moray, whereas the 18-64 year population has increased by 19% and the over 65 population by 69%. In Aberdeenshire the over 65 population has more than doubled (116%).
Figure 2 – Population trends in Grampian, Aberdeen City, Aberdeenshire and Moray, 1991-2025. Click on the image to enlarge.
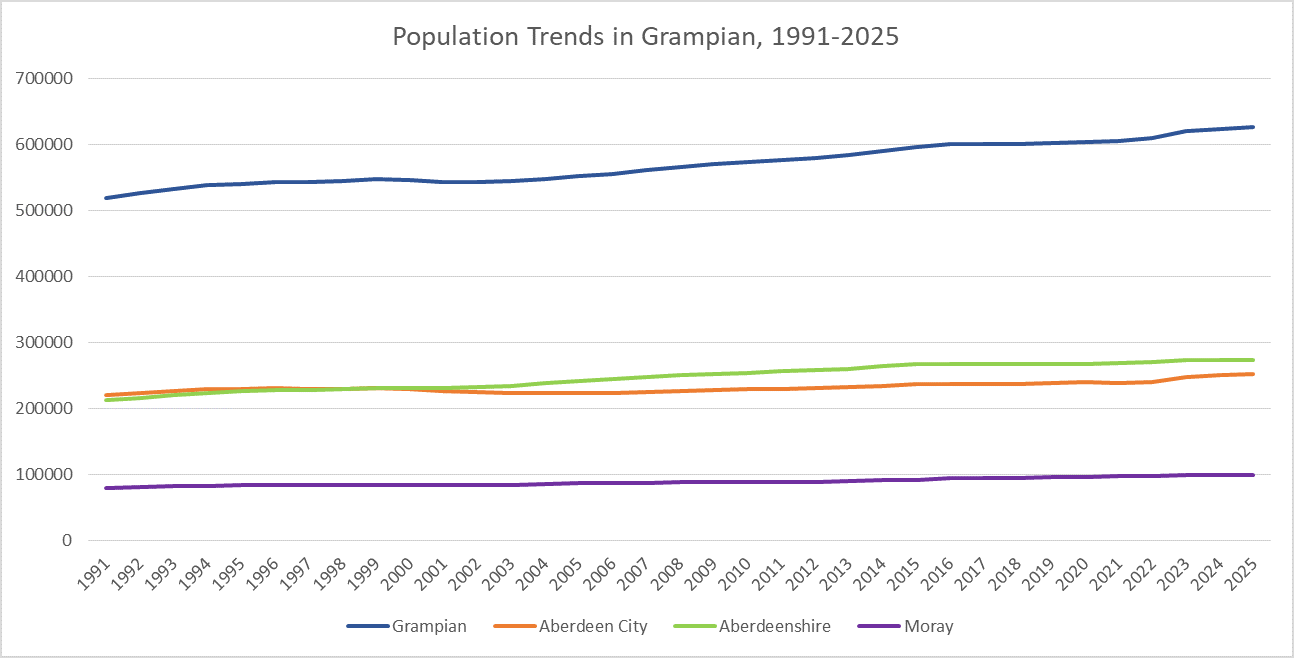
Source: Local CHI Register information
Figure 3 – Pie chart showing the population by Local Authority. Click on the image to enlarge.
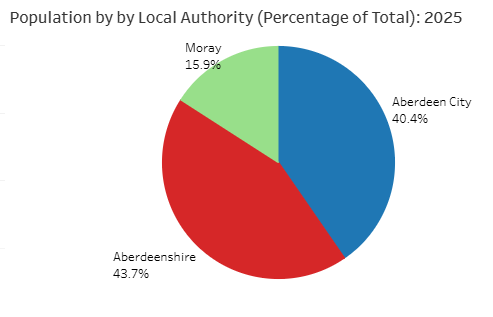
Figure 4 – Percentage change in population across Grampian, and by local authority. Click on the image to enlarge.
Back to Top