SIMD
Deprivation is recognised as a key determinant of health and has a direct impact on an individual’s life expectancy and quality of life – referred to as healthy life expectancy (see sections below on LE and HLE for more information).
Scottish Index of Multiple Deprivation (SIMD) is a standard tool used to identify areas with relatively high levels of deprivation (Scottish Index of Multiple Deprivation 2020 – gov.scot). In using this tool, it allows the population to be split into 5 different sections – called quintiles – based on their level of deprivation, with quintile 1 being the most deprived and quintile 5 the least deprived. This tool considers deprivation across seven domains: income, employment, education, health, access to services, crime and housing (Scottish Index of Multiple Deprivation 2020 – gov.scot). Each quintile consists of a number of small areas known as datazones.
It should be noted that SIMD is an area-based measure of relative deprivation: not every person in a highly deprived area will themselves be experiencing high levels of deprivation. Likewise, small pockets of deprivation can exist in areas which are not classed as deprived overall.
Datazones in rural areas tend to cover a large land area and reflect a more mixed picture of people experiencing different levels of deprivation. This means that SIMD is less helpful at identifying the smaller pockets of deprivation found in more rural areas, compared to the larger pockets found in urban areas. SIMD domain indicators can still be useful in rural areas if analysed separately from urban data zones or combined with other data.
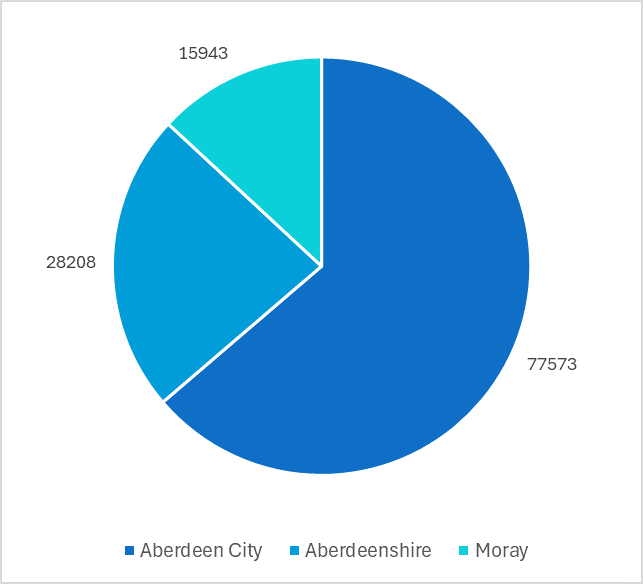
The overwhelming majority (64%) of the population living in the most deprived quintile live in Aberdeen City (Figure 14). 23% live in Aberdeenshire and 13% in Moray.
Figure 9- Population Breakdown by Local Authority, Most Deprived Quintile, 2025
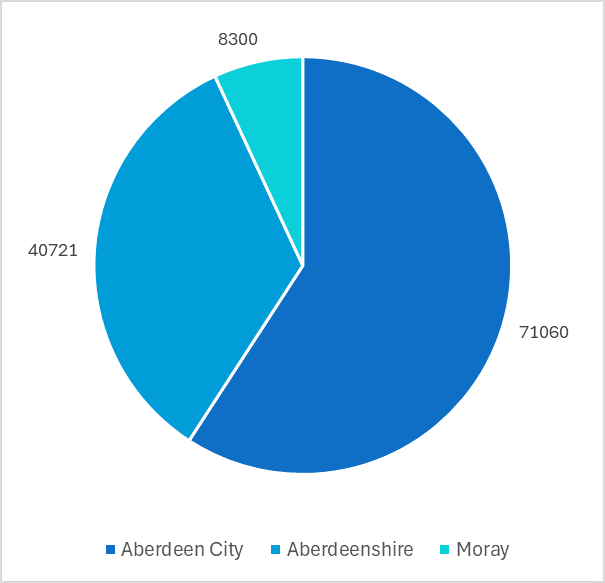
The population breakdown (number of residents living in each quintile) of the least deprived quintile is remarkably similar to the most deprived, with the vast majority (59%) residing in Aberdeen City (10). However, a higher proportion live in Aberdeenshire (34%) and lower proportion in Moray (6%).
Figure 10 – Population Breakdown by Local Authority, Least Deprived Quintile, 2025
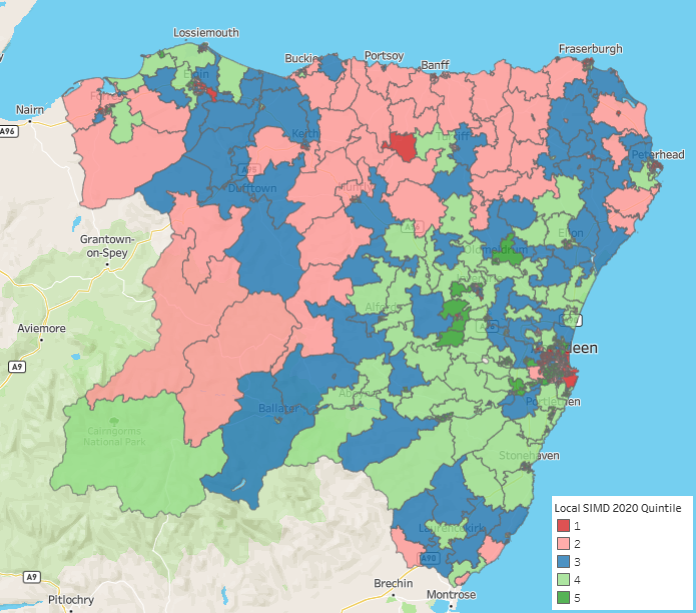
Outside of Aberdeen City, the most deprived areas are mainly found around the larger towns of Elgin, Peterhead and Fraserburgh as well as Banff and Aberchirder (Figure 11). The least deprived areas are mainly located in Central and Southern Aberdeenshire.
In general, the rural areas of Moray and North Aberdeenshire are more deprived than the rural areas of Southern and Eastern Aberdeenshire.
Figure 11- Distribution of Local SIMD Quintiles across Grampian
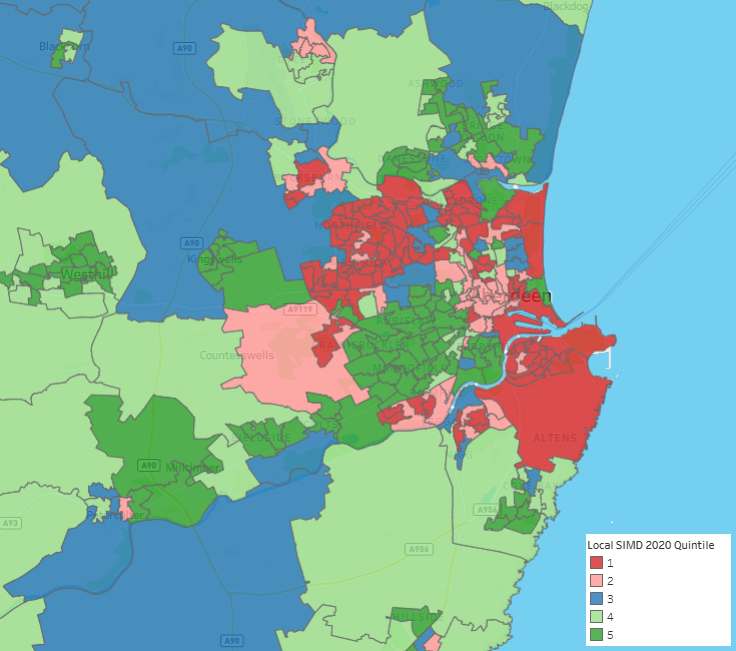
Within Aberdeen City the most deprived areas are concentrated in Central and Eastern areas, particularly Torry, Seaton, Tillydrone, Woodside and Northfield. The least deprived areas are in the South West and North and include West End, Midstocket, Cults, Milltimber and Bieldside (Figure 12).
Four datazones in West End and Midstocket rank amongst the ten least deprived datazones in Scotland whereas only two datazones in the whole of Grampian (one in Torry and one in Woodside) even fall within the 500 most deprived datazones in Scotland.
Figure 12- Distribution of Local SIMD Quintiles across Aberdeen City and surrounding areas
In the most deprived quintile (SIMD1) there are fewer elderly people but the proportion of children is similar to the other quintiles . The breakdown in quintiles 2 to 5 is remarkably similar.
Figure 13 – Population Breakdown by Local SIMD Quintile, Grampian, 2025
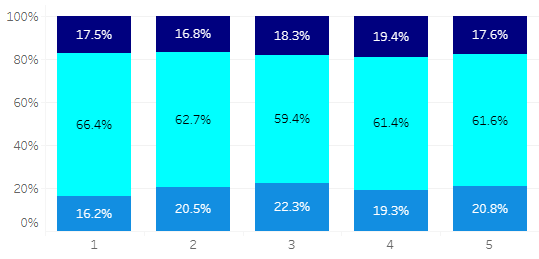
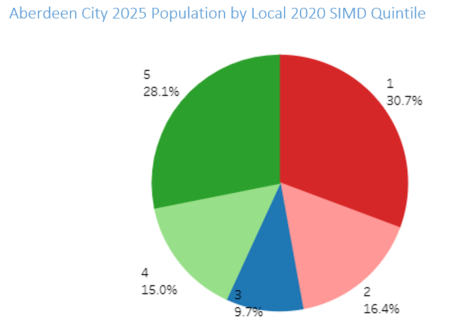
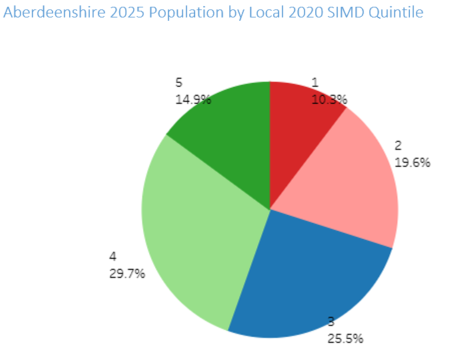
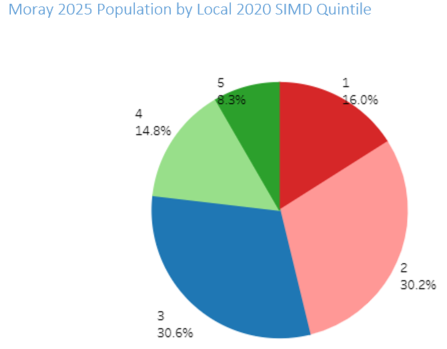
Figure 14 summarises the proportion of population for each area in Grampian by deprivation quintile. In Aberdeen City (Figure 14a) the population is more polarised than in Aberdeenshire (Figure 14b) and Moray (Figure 14c) with the highest proportion in both the most deprived quintile (30.7%) and least deprived quintile (28.1%). This polarisation means health inequalities are highly geographically concentrated, particularly in parts of Aberdeen City. Reducing deprivation-linked gaps will require targeted local action, from early years to adulthood. Aberdeenshire has the highest proportion in the two least deprived quintiles (44.6%) and the lowest proportion in the two most deprived quintiles (29.9%). In Moray the majority of the population falls in to quintile 2 and 3 (60.8%) with only 23.1% falling in to the two least deprived quintiles. These differences in deprivation profile means that services need to be delivered in different ways to best meet the needs of the local population, which is challenging.
Figure 14 – Local population by SIMD Quintile for (a) Aberdeen City, (b) Aberdeenshire and (c) Moray.
(a) Aberdeen City 2025 Population by Local 2020 SIMD Quintile. Click on the image to enlarge.
(b) Aberdeenshire 2025 Population by Local 2020 SIMD Quintile. Click on the image to enlarge.
(c) Moray 2025 Population by Local 2020 SIMD Quintile. Click on the image to enlarge.
Back to Urban/Rural Split
Next to Birth Trends
Back to Population Demographics