Mortality
Death Rates (All Ages)
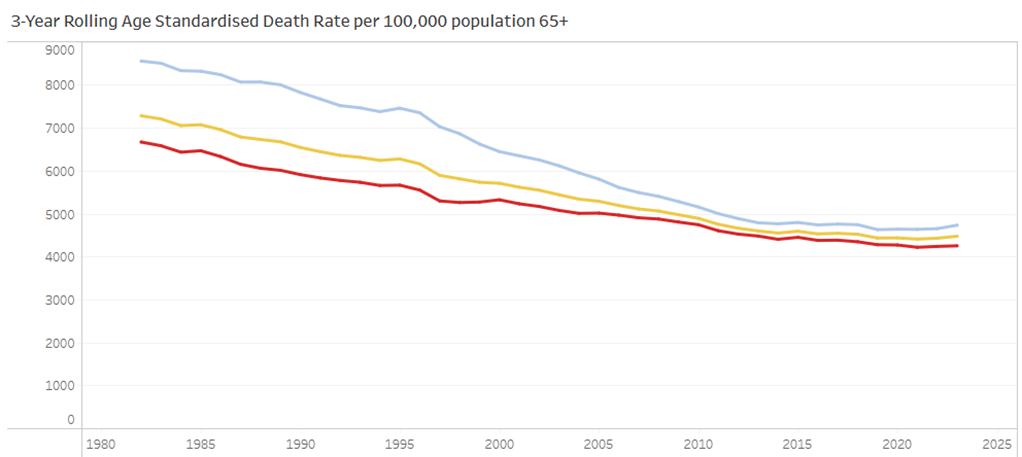
Death rate in a population is an important measure as it gives a good indication of the health and well-being of the population. Information on deaths (all ages) are based on a 3 year rolling average number and directly age sex standardised rate per 100,000 population. Figures 44 and 45 show the trend in age standardised death rates overall for Grampian and broken down by sex for the under 65Y (0-64) and, 65Y and over age groups, respectively.
In both these age groups, the death rate for males is consistently higher than for females at all time points. The under 65 year old male age standardised death rate halved between the 1980s and 2015 before gradually rising. A similar, but less dramatic trend is evident amongst females aged under 65. A similar trend is evident amongst over 65s.
Figure 44 – Trends in age standardised deaths rates (per 100,000 population) for under 65Y population. Click on the image to make it bigger.
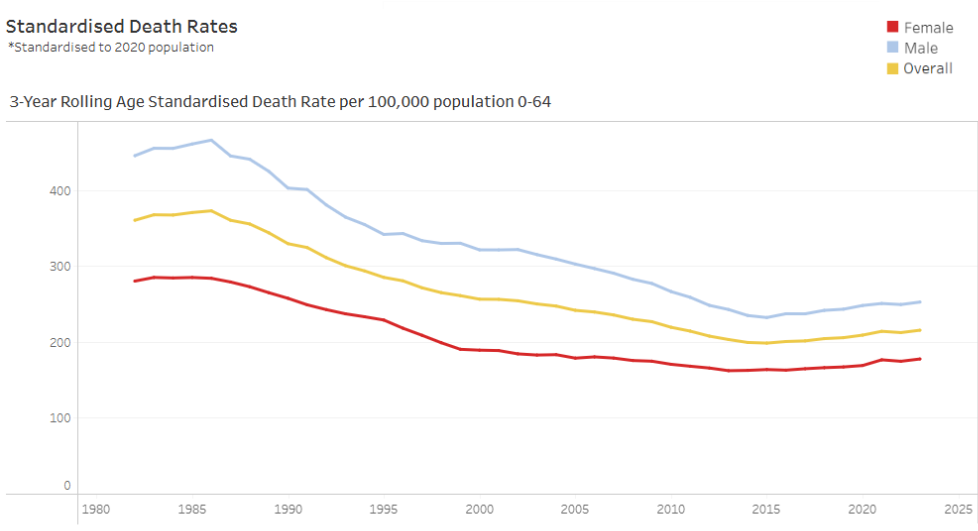
Figure 45 – Trends in age standardised deaths rates (per 100,000 population) for under 65Y population. Click on the image to make it bigger.
Back to Top
Back to Chronic Morbidity Overview
Next to Causes of Deaths
Back to Overview of Grampian’s population characteristics and health status