Avoidable & Preventable Deaths
Avoidable mortality is defined as deaths that are either preventable or treatable in accordance with the following definitions:
- A (cause of) death is classified as preventable when it can be mainly avoided through effective public health and primary prevention interventions.
- A (cause of) death is classified as treatable when it can be mainly avoided through timely and effective healthcare interventions.
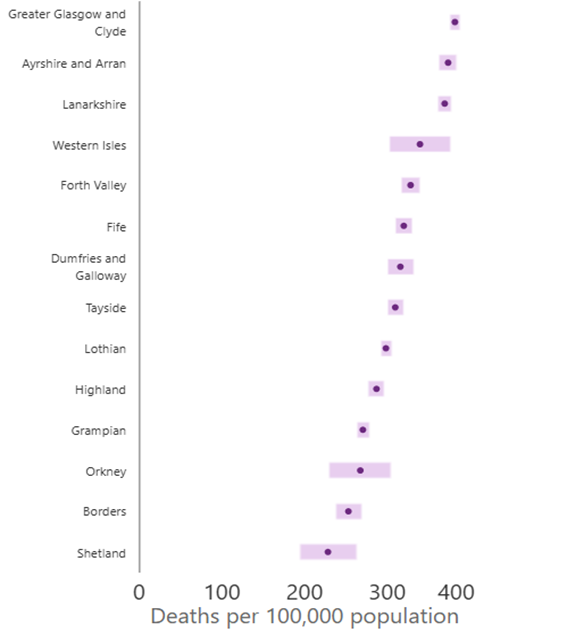
Figure 49 below shows that Grampian has one of the lowest avoidable mortality rates in Scotland, with Borders the only mainland board to have a lower rate over the 2020-23 period.
Figure 49 – Avoidable mortality rates by Health Board, all persons: 2020 to 2023 average. Click on the image to make it bigger.
Despite Grampian having one of the lowest avoidable mortality rates in Scotland, the trends in percentage of avoidable deaths over time has varied across Grampian (Figures 50 –53). Trends overall in Grampian, Aberdeenshire and Moray have shown a decline in the percentage of avoidable deaths in the last decade but this is not the case for Aberdeen City where the percentage has risen.
Figure 50 – Trends in avoidable and non-avoidable deaths percentages for Grampian (2000-2024). Click on the image to make it bigger.

Figure 51 – Trends in avoidable and non-avoidable deaths percentages for Aberdeen City (2000-2024). Click on the image to make it bigger.
Aberdeen City
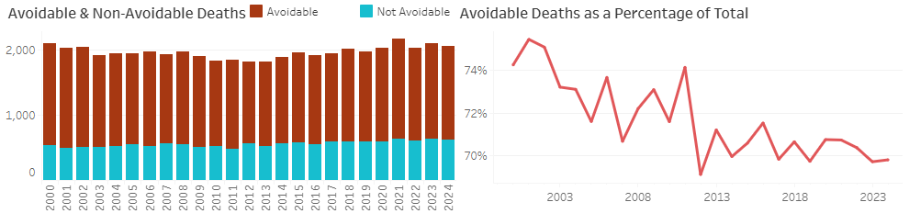
Figure 52 – Trends in avoidable and non-avoidable deaths percentages for Aberdeenshire (2000-2024). Click on the image to make it bigger.
Aberdeenshire
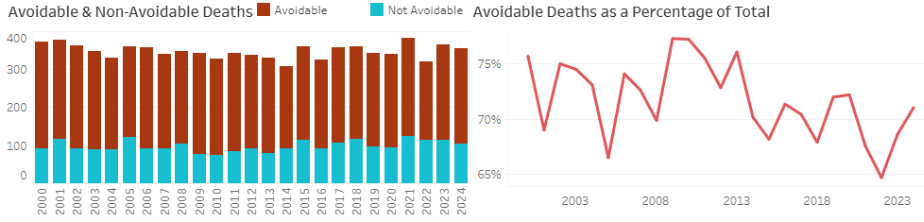
Figure 53 – Trends in avoidable and non-avoidable deaths percentages for Moray (2000-2024). Click on the image to make it bigger.
Moray
Avoidable mortality remains a concern in the more deprived areas of Grampian. Figure 54 below shows that the avoidable mortality rate is around 2.5 times higher in the most deprived quintile compared to the least deprived quintile.
Figure 54 – Avoidable Deaths per 100,000 population. Click on the image to make it bigger.
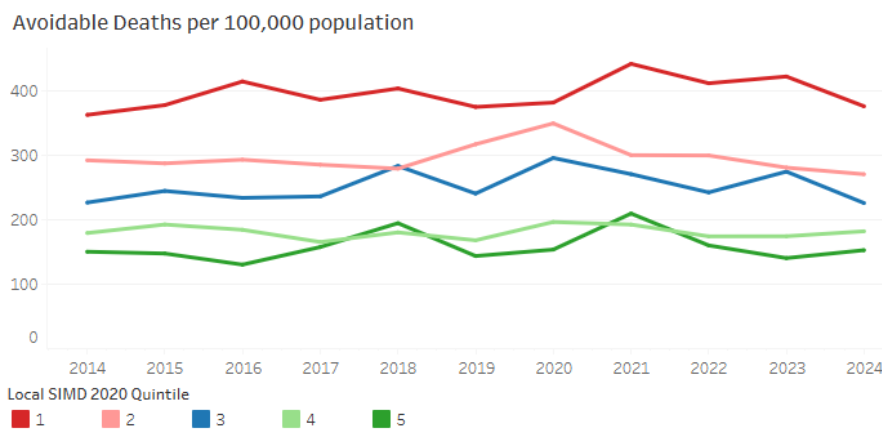
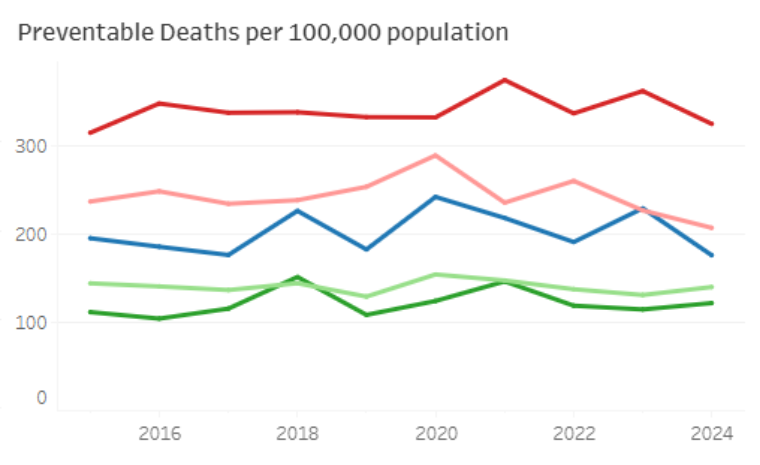
Figure 55 shows that the preventable mortality rate is 2.7 times higher in the most deprived quintile compared to the least deprived quintile highlighting the importance of the wider determinants of health and their association with poorer health.
Figure 55 – Preventable Deaths per 100,000 population by SIMD Quintile. Click on the image to make it bigger.
Back to Top
Back to Causes of Death
Next to Prevention & Risk Factors
Back to Overview of Grampian’s population characteristics and health status