Service Use
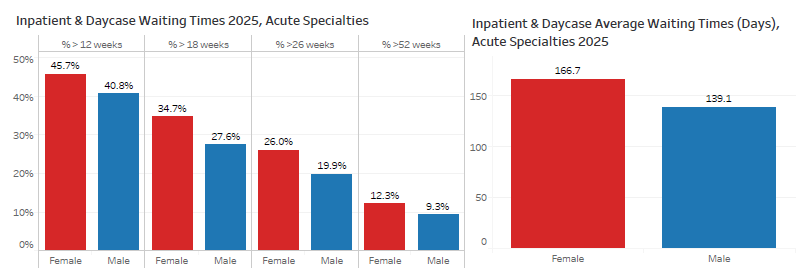
Waiting times for inpatient and daycase services in Grampian have been longer since the pandemic and data shows that women waited 27% longer than men in 2025 – an average of 166.7 days compared to 139.1 days.(TrakCare Patient Management System) (Figure 70) 12.3% of women waited over a year for their inpatient or daycase admission compared to 9.3% of men.
Figure 70 – Inpatient and Daycase Waiting Times in Grampian, 2025. Click on the image to enlarge.
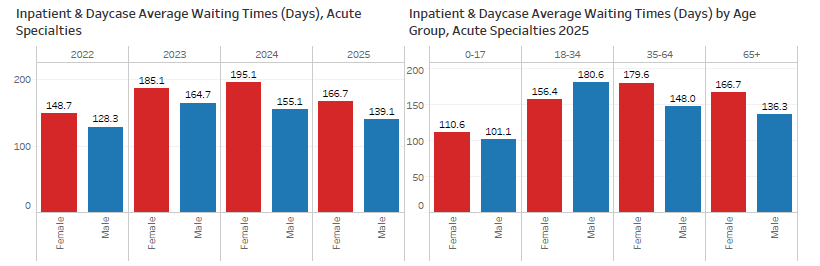
Women wait on average longer than men in all age groups except 18-34 years (Figure 71).
Figure 71 – Inpatient and Daycase Waiting Times in Grampian by year and age group. Click on the image to enlarge.
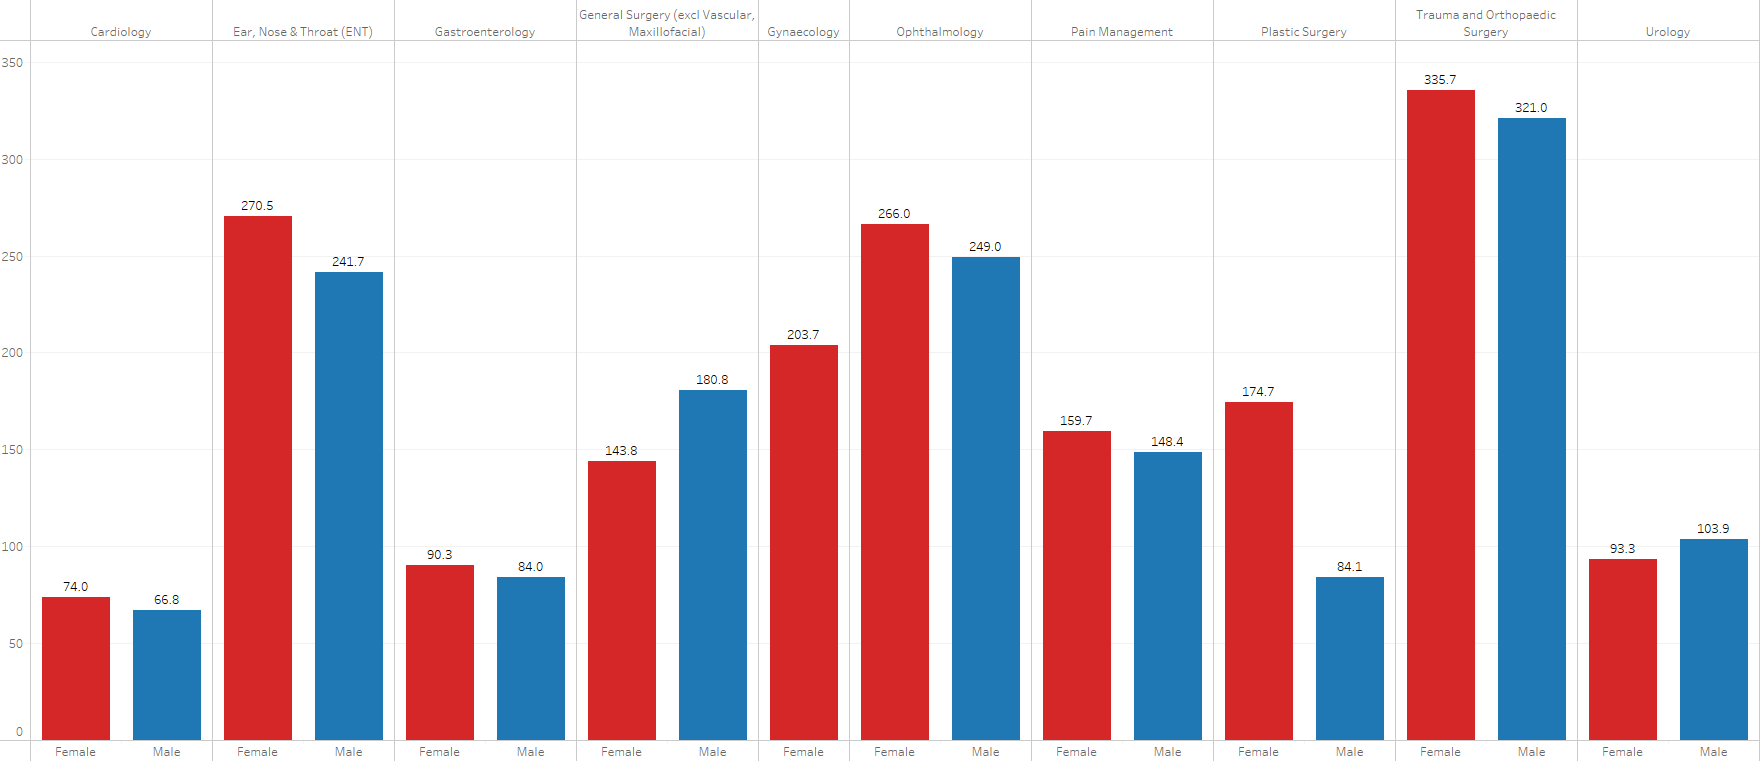
Of the ten specialites with the greatest volume of elective activity in 2025, women waited longer on average in seven of them with a particularly marked difference in Plastic Surgery (Figure 72). Men waited longer on average in General Surgery and Urology.
Gynaecology waiting times were longer than all of the other main specialties with the exception of ENT, Ophthalmology and Orthopaedics.
Figure 72 – Average Inpatient & Daycase Waiting Times by Specialty and Gender, 2025. Click on the image to enlarge.
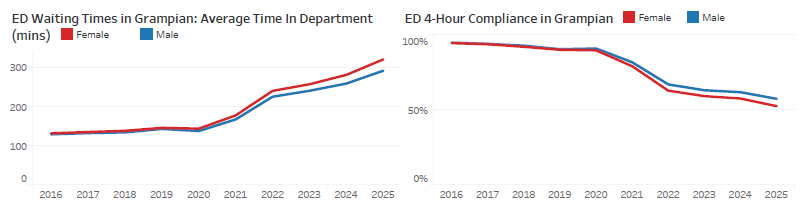
ED waiting times are also longer for women and compliance with the 4 hour target, lower. (TrakCare Patient Management System). These differences have been growing in recent years (Figure 73).
Figure 73 – ED Waiting Times in Grampian. Click on the image to enlarge.
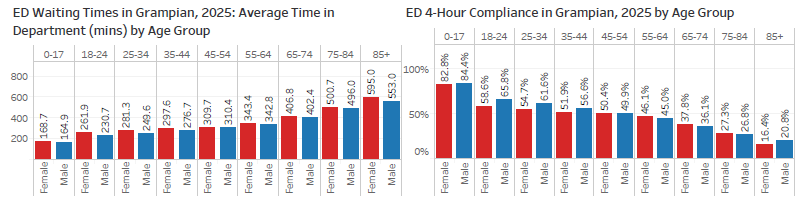
Waiting times are longer and 4 hour compliance lower for females in all age groups except 45-54 years (Figure 74)
Figure 74 – ED Waiting Times in Grampian by Age Group, 2025. Click on the image to enlarge.
Back to Prevention & Risk Factors
Back to Overview of Grampian’s population characteristics and health status