Gender breakdown
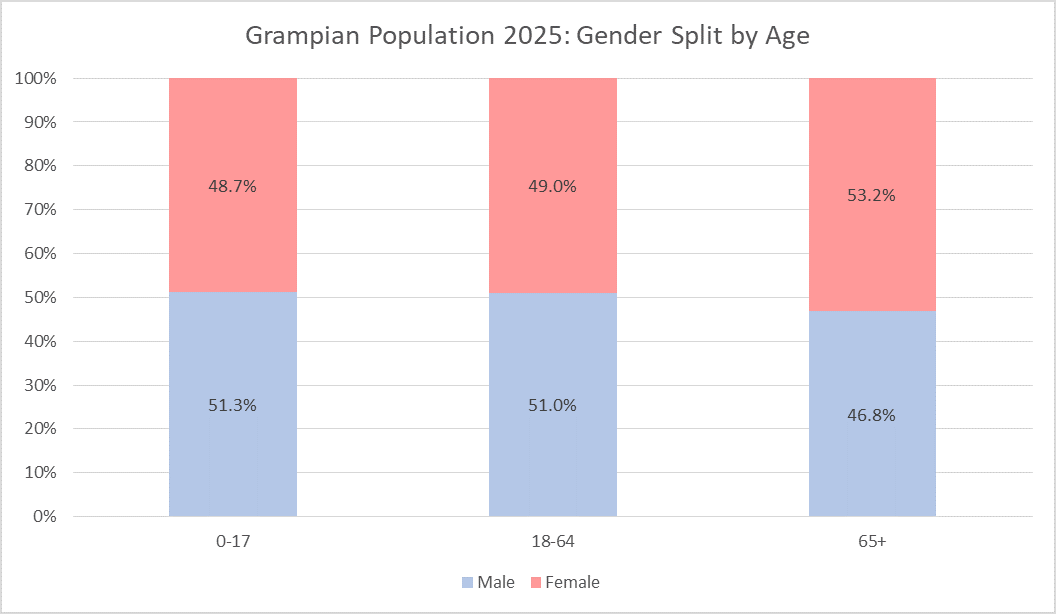
Gender breakdown across the key age groups in Grampian is shown in Figure 7. Just over half the under 18 population and the working age (18-64) is male (51%). In contrast, the older population (aged 65+) the gender split is slightly different as there are more females (53%), reflecting lower life expectancy for males.
Figure 7 – Gender Split by age group for Grampian. Click on the image to enlarge.
Back to Age breakdown
Next to Urban/Rural Split
Back to Population Demographics